
Fitness evaluation and evolution
If you arrived directly on this page from a link, visit the introduction and table of contents.
This section describes :
- The usage of a Swiss tournament to assess fitness.
- The evolutionary algorithms used to improve ANNs.
- The design of a variant of Swiss tournaments to address some issues.
Single column Swiss tournament (SCST)
The initial set of teams each have a distinct ANN with weights randomly uniformly generated be between -1 and 1. This set of teams will form the first generation. We begin with only one set and call such sets columns for reasons that will become more apparent later on.
In order to train the ANNs, a way to evaluate the performance of a team is required. The Influence Game is a competitive scenario: in order for a team to win, another team has to lose, in contrast to other tasks such as learning how to walk. The main trait required from an ANN is its ability to win against other ANNs. The margin of victory (difference in the number of points) also contains useful information - however, it is used only as a tiebreaker for the number of wins. Indeed, a team could develop a strategy that only wins by a small margin, but does so consistently.
The trivial way to compare a set of ANNs is to have a full tournament consisting in having a match between every pair of ANNs. However, as noted by Fehérvári and Wilfried1, that method is too slow to be computationally viable. A full tournament requires n(n-1)/2 rounds. We therefore decide to adopt the method of Swiss tournament, which requires only [log2(n)/2]*n/2 matches. Indeed, on our testing machine featuring a AMD x6 1100t 3300MHz 6-core processor can carry about around 180 matches per second. Given that we are generally interested in evolving sets of more than 64 ANNs for hundreds of generations, it would take weeks to run each experiment.
In this implementation, ANNs are ranked by their number of wins (matches won), then by their number of points. For each round, starting with the top ranked ANN, we attempt to find a valid matchup with another ANN of similar rank. A matchup is valid if it has not occurred previously in the tournament. In pseudo-code, The procedure for ranking a set of ordered ANNs would be :
procedure MatchANN(set-of-ANNs, current-index)
    if current-index = set-of-ANNs.size
        // Base case
        end
    else if set-of-ANNs[current-index] is already matched
        // Move to next
        matchANN(set-of-ANNs, current-index + 1)
    else
        for each ANN n with index higher than current-index
            if n has not been matched in this round
            and if set-of-ANNs[current-index] not matched with n previously
                match(set-of-ANNs[current-index], n)
                // Move to next
                matchANN(set-of-ANNs, current-index + 1)

procedure SwissTournament(initial-set, number-of-rounds)
    let current-set = initial-set
    for each round in number-of-round
        MatchANNs(current-set, ceil(log2(initial-set.size)))
        Carry out all matches
        current-set = RankAndSort(current-set)
The full procedure includes some technicalities that allow backtracking in cases where not every team is paired for a match. A special case in the tournament is the first round, when all teams have the same score. There we use fold pairing, which prevents teams the best teams from the previous generation from playing against each other too soon.
Given n teams, a Swiss Tournament typically requires k = ceil(log2(n)) rounds in order to determine an absolute winner. This is because teams with no losses are paired up against each other, thus the number of teams with no losses decreases by half every round. k is not sufficient to make a pairwise distinction between all teams; there will be multiple teams with the same number of wins. In our application, this is acceptable as we only need to be able to determine which teams are in the first quartile.
Furthermore, our implementation of Swiss tournament assumes the following for simplification purposes :
- No ties (a team either wins or loses)
- No drops (every team plays until the end of the tournament)
- No byes (even number of teams ensure every team is paired up)
example, with initial teams labelled from 1 to 8:
| Round 1 | |||
| Positive Team | Score | Negative Team | Score |
| 1 | 0 | 8 | 0 |
| 2 | 0 | 7 | 0 |
| 3 | 0 | 6 | 0 |
| 4 | 0 | 5 | 0 |
| Suppose 1, 2, 5, 6 win | |||
| Round 2 | |||
| Positive Team | Score | Negative Team | Score |
| 1 | 1 | 2 | 1 |
| 5 | 1 | 6 | 1 |
| 3 | 0 | 4 | 0 |
| 7 | 0 | 8 | 0 |
| Suppose 2, 3, 5, 8 win | |||
| Round 3 | |||
| Positive Team | Score | Negative Team | Score |
| 2 | 2 | 5 | 2 |
| 1 | 1 | 3 | 1 |
| 6 | 1 | 8 | 1 |
| 4 | 0 | 7 | 0 |
| Suppose 2, 3, 4, 6 win | |||
The final rankings, a "column" of teams.
| Final Results | |||
| Ranking | Team | Score | |
| 1 | 2 | 3 | |
| 2 | 5 | 2 | |
| 3 | 3 | 2 | |
| 4 | 6 | 2 | |
| 5 | 1 | 1 | |
| 6 | 8 | 1 | |
| 7 | 4 | 1 | |
| 8 | 7 | 0 | |
Evolutionary Algorithm
After a tournament is over and every teams have been ranked, the next step is to create a new generation of teams. To do, we create a DNA sequence identifying the properties of each team, by mapping all the weights of its neural network into a one-dimensional array. Each weight will represent a single gene.
We then apply the following evolutionary methods :
- The top 25% best performing ANNs (elites) are carried over to the next generation
- Every elite is paired with another elite and produces two offspring by uniform crossover
- Twice the number of elites are created through mutation. The mutation consists in :
- Selecting a random elite and creating an identical offspring
- Every gene in the offspring has a 10% chance of being rerolled between [-1 and 1]
- Every gene in the offspring has a 30% chance of being multiplied by up to 30%, with a larger chance of a small change
The procedure of ranking ANNs through a Swiss tournament and evolving them is repeated every generation.
In order to measure the improvement (or decrease) in performance of the teams, we keep track of the elites of each generation (top 25%) in an array. Those elites are stored in a separate array cell corresponding to their generation. It is possible that a given team is present as an elite throughout multiple generations. In that case, the team is kept only in the cell corresponding to the last generation in which it was an elite, which we define as the team's associated generation.
After the simulation has reached the last generation, we are left with an array containing a list of up to (teams/generation) * number of generations * .25 teams. However, since a given team competes for 2-3 generations on average, the actual number will usually be around 40% of the maximum. A large-scale Swiss tournament is then performed with every team in that list. If the number of teams is odd, we simply remove an ANN from the first generation to ensure that there are no byes.
In other words, we are comparing the top teams of each generation. Once the final ranking tournament is over, we proceed to plot every team in a graph of their ranking vs their associated generation.
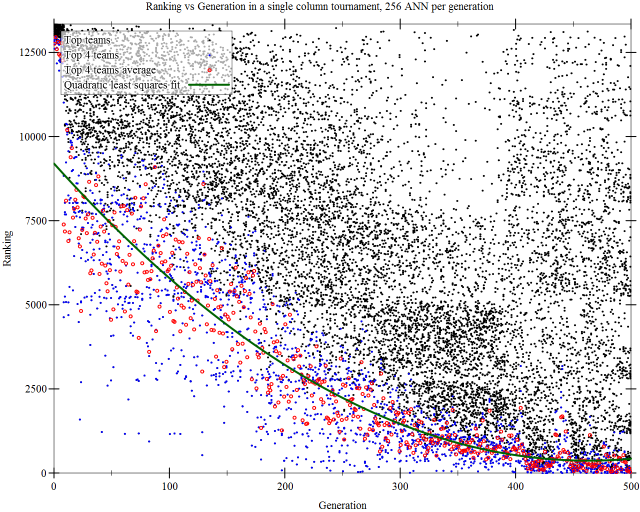
The graph below represents a possible outcome for a simulation of 500 generations, 256 teams/generations. 13345 distinct teams have been ranked in the final tournament. The top 4 teams of each generation are highlighted in blue as they represent the very best of the generation. Other teams may be promising but unpolished variants. We can observe that teams improve in performance over the generations, with a decreasing rate of improvement.
Side note : The image was rendered with built-in Racket libraries for plotting data points and graphs. As I was looking for better ways to plot graphs than excel, my CS professor, Prabhakar Ragde, suggested that I use the programming we were learning. Though there's a slightly steeper learning curve than using some dedicated software, it is very convenient as the programming language itself allows me to pre-process data points in a clean and efficient manner. I am also very impressed by the quality of the graphs it can produce.
Issues with the methodology
While the teams get progressively better over time, able to rank better than teams from earlier generations, the strategy they develop is not the sort of results we would desire. Excluding some rare mutation that could create a team with a competitive novel strategy, the population will quickly converge to a set of similar team. Due to elite selection, the gene pool diversity will decrease quickly. The teams will then adopt a behavior suited specifically to playing against itself, which is not an interesting desired behavior.
The video above shows a sample match between two of the top performing teams from the previous graph. The positive team (red) wins by 3007 points. We can observe that players adopt the strategy of moving to the left upon approaching opponents. This is a passive behavior similar to walking on the right side of a corridor to avoid collision. Almost all of the later-generation teams adopt this behavior, so the teams are not competing on strategy so much as moving into place and doing a slightly better job avoiding being removed from the field. We would think that the artificial neural networks could produce more active, elaborate behavior.
Thus, in our experiment, a naive Swiss tournament is not the proper methodology to compare different teams.
Multi column Swiss tournament (MCST)
The method we use to avoid having ANNs converge too quickly into a local minimum is to separate them in multiple columns. We initially create N sets (columns) of K random artificial neural networks. Teams in one column compete against teams in other columns, but there is no competition among teams of the same column. The procedure for ranking teams is similar to a Swiss tournament. We begin by choosing 2 columns among the N available, say A and B, to be paired against one another - column pairing. Then, we do column-wise pairing; we attempt to pair the best team of column A with the best team of column B if they have not been matched together in a previous round. After each round, the teams are sorted within their own column by their performance and we match them up again. Since both columns have K teams, there will be no byes.
The performance of a team is thus determined by its total number of wins across all column pair-ups. To ensure that the results are invariant under the ordering of column pair-ups, we tally the number of wins only at the end. When two columns are paired up, the teams do not start with a ranking for the purpose of the pair-up. In pseudo-code :
procedure MatchANN(set-of-ANNs1, set-of-ANNs2, current-index)
    if current-index = set-of-ANNs1.size
        // Base case
        end
    else
        for each ANN n in set-of-ANNs2
            if n has not been matched in this round
            and if set-of-ANNs1[current-index] not matched with n previously
                match(set-of-ANNs[current-index], n)
                // Move to next ANN in first set
                matchANN(set-of-ANNs, current-index + 1)

procedure MultiSwissTournament(initial-columns, number-of-rounds)
    for i = 0 to initial-columns.size - 1
        for j = i + 1 to initial-columns.size - 1
            let current-set1 = initial-columns[i]
            let current-set2 = initial-columns[j]
            for each round in number-of-round
                MatchANNs(current-set1, current-set2, arbitrary-number)
                Carry out all matches
                current-set1 = Rank(current-set1)
                current-set2 = Rank(current-set2)
            Set aside score for column i
            Set aside score for column j
example, with initial teams labelled from A1 to A4 for column A, B1 to B4 for column B
| Round 1 | |||
| Column A | Score | Column B | Score |
| A1 | 0 | B1 | 0 |
| A2 | 0 | B2 | 0 |
| A3 | 0 | B3 | 0 |
| A4 | 0 | B4 | 0 |
| Suppose A1, B2, B3, B4 win | |||
| Round 2 | |||
| Column A | Score | Column B | Score |
| A1 | 1 | B2 | 1 |
| A2 | 0 | B3 | 1 |
| A3 | 0 | B4 | 1 |
| A4 | 0 | B1 | 0 |
| Suppose A1, A2, B4, B1 win | |||
| Round 3 | |||
| Column A | Score | Column B | Score |
| A1 | 2 | B4 | 2 |
| A2 | 1 | B2 | 1 |
| A3 | 0 | B3 | 1 |
| A4 | 0 | B1 | 1 |
| Suppose A1, A2, B3, B1 win | |||
The final rankings, a "column" of teams.
| Final Results | ||||
| Ranking | Column A | Score | Column B | Score |
| 1 | A1 | 3 | B1 | 2 |
| 2 | A2 | 2 | B3 | 2 |
| 3 | A3 | 0 | B4 | 2 |
| 4 | A4 | 0 | B2 | 1 |
First, notice that in the case of MCST, the number of rounds in a column pair-up can be arbitrary. Over all pair-ups, a given team will end up playing more matches than it would in a SCST to begin with. Secondly, there is no guarantee that the MCST will efficiently differentiate the best teams (see Team B in previous example) although in general, that is acceptable as we keep an entire quartile to carry over to the next generation.
Given this method, the best teams will be versatile enough to beat a number of different strategies from other columns. They will evolve and adapt to defeat other strategies, as opposed to its own.
Again, at every generation, we record the top 25% of teams in every column. After n generations, we have up to n * number of teams per generation * .25 per column, which we merge into one large column for the final tournament that determines the ranking of teams in relation to their associated generation.
As in the case of SCST, the number of teams in the final columns is around 40% of the theoretical maximum since teams survive for 2-3 generations on average. Note, however, that with MCST, the number of teams in each column will not necessarily be the same for all columns. It is possible, for example, that column A evolves more slowly than column B such that an average team in A survives for 1 more generation than the average team in B. That creates a difficulty for the final tournament since it requires an equal number of teams in each column to be allow column pairings.
We decide to remove teams randomly from each column until each column has the same number of teams. Let k = min{teams in column 1, teams in column 2, ..., teams in column n}. A random team is selected and removed from each column until there are k teams in that column. We choose this method of removal to maintain the expected number of total wins by all teams in each column. If we were to remove teams from earlier generations or teams from later generations, it may give an advantage or disadvantage, respectively, to columns with more than k teams. Randomness guarantees a certain degree of uniformity in the removal process.
Next, we present a sample test case with ANNs evolved using the MCST ranking system and analyse the findings.