
To log or to not log
Sometimes, in digital signal processing, we work with the logarithm of a function. The reason why : the human ear can hear rustling leaves quite clearly. It can also obviously hear music at a rock concert. The latter is more than ten million times louder in the intensity of the sound waves. If we were to plot both sounds on a graph based on the intensity, the leaves wouldn't even appear on the chart - but we would probably like it to. Thus, taking the logarithm represents sound on the decibel scale, which is easier to wrap our heads around.
Now say we take a signal and we want to downsample it by a factor of two, by taking the average of two neighbors at the time. Should we take the average before or after taking the logarithm? Well, let's first observe that if we take it before, then :
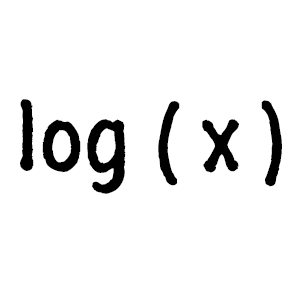
\[ Z = \frac{log(x) + log(y)}{2} = \frac{log(x*y)}{2} = log(\sqrt{x*y}) \]which is the geometric mean, in contrast to the arithmetic mean
\[ Z = log(\frac{x+y}{2}) \]Intuitively, it seems to make more sense to take the arithmetic mean. This is because the log is only a final adjustment step that rescales data after we are done processing it.
What about analysis of the data. Here, the answer will most likely depend on the analysis we want to do. I was curious to see whether music onset detection and segmentation via self-similarity matrices would work better in the linear scale or the log scale. So I tried a few songs, and here's the result for one of them :

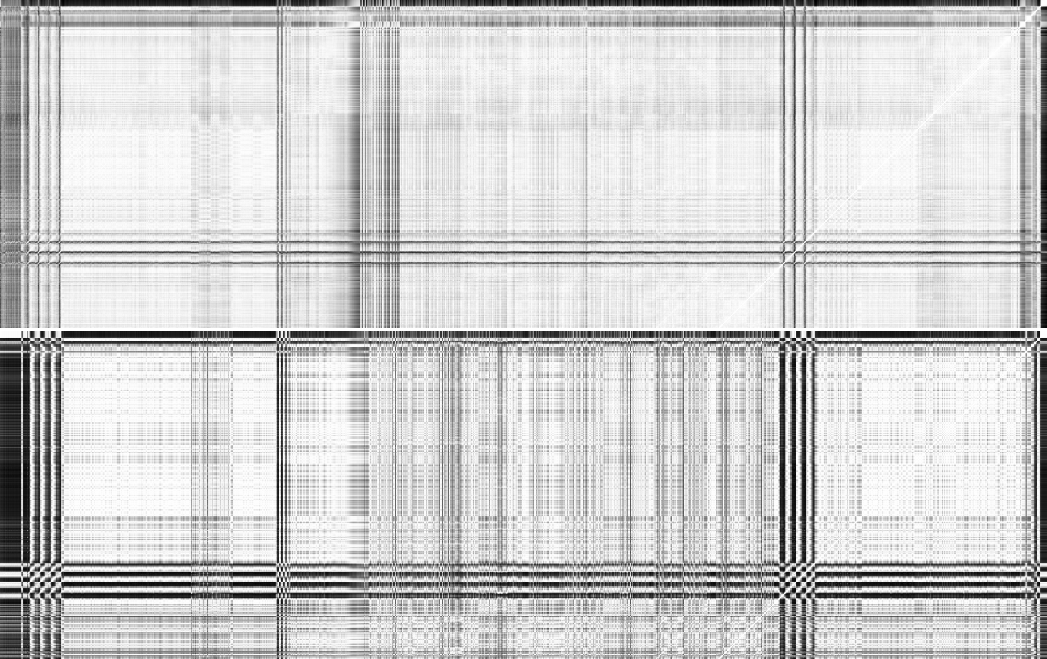
In both images, the first is analysis done on a log scale, the second is analysis done on a linear scale.
The first image shows the gradient of the spectrum of a song in the time axis. The relative brightness varies - that's not important, it's just due to the fact that I had to take the log of the gradient to be able to see everything (same principle as with the leaves vs rock concert). What is important, however, is that we want a musical note to be ideally very localized in time, to appear as a straight vertical line in the gradient. The analysis on the log scale leads to longer, less broken up lines that jiggle less. Which is good.
As for the self-similarity matrix well...it's pretty clear that analysis on the linear scale is a big mess and will produce many false positives.
So in this application, analysis on the log scale is better! My hunch is that taking the log reduces variation among data points, which leads to smoother results.
