
Deriving the continuous wavelet transform from Canny edge detection
At one point during my research on detecting musical notes/onsets, I came up with the idea of using my previous experience with the Canny edge detector, or some variation of it. Previously, I had worked with the detector focusing mainly on the implementation. I didn’t quite bother to consider why it was a good algorithm, only having some vague knowledge that it has been proven to be “optimal” under some criteria. Then, as I adapted the algorithm (mainly used for computer vision) to onset detection, I realized to my surprise that there are close ties between edge detection and the continuous wavelet transform.
In any case, this isn't a derivation of a formal relationship between the two so much as a derivation of an intuitive relationship, and people having studied digital signal processing may find it obvious, but I was quite happy when I found it. This post doesn't assume much background knowledge on DSP, so read on!
What is the Continuous Wavelet Transform?
In a previous post, I mentioned that any function (or discrete signal) can be represented as a sum of infinitely many sinusoidal of varying intensity and frequency. This meant that sound can be decomposed into its constituent frequencies. A car siren is made up of simpler signal of high frequencies. A bass note is made up of simpler signal of low frequencies.
The Fast Fourier Transform (FFT) allows us to extract the amplitude of those sinusoidal. However, there is one one little problem: a sine wave looks the same from -infinity all the way to +infinity. If a song has many high-pitched notes, it will be made up of sine waves with short wavelength, but we won't know where the notes are located in time. A solution is the Short Time Fourier Transform (STFT), which takes the Fourier Transform on small pieces at the time. However, there's an uncertainty principle idea that applies to that method. We can distinguish frequencies more effectively only by taking large chunks of signal at the time. Conversely, by analyzing smaller pieces of the song, we get a more precise localization of onsets, but less precision in distinguishing frequencies. In order to get a better frequency resolution, we need to sacrifice time resolution and in order to get a better time resolution, we need to sacrifice frequency resolution.
Fortunately, we got an alternative: Wavelets. To see them in action :
What you've seen in the video is a spectrogram : a graph of intensity with respect to frequency and time. It's similar to the spectrogram generated by a fast fourier transform, except that with wavelets, the resolution is much higher. An excellent (and fairly readable) tutorial on wavelets can be found here.
Derivation
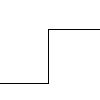
To begin with, let us consider a computer science problem that seems, at first, very much unrelated to frequency decomposition : edge detection. What does it mean for an image, such as the one below, to have an edge?

We can define an edge as locations in the image where we get the greatest changes in color. In one dimension (which we will use, for simplicity), the simplest type of edges are step edges, like so :
From calculus, we know that points where a function changes a lot means points where the first derivative is relatively large. Of course, since we are working with discrete data, we don't have the formal notion of derivatives, only deltas. To get the 'derivative' (I will keep referring to it as such for convenience) of a function F at point x, we could calculate F(x + 1) - F(x). Or F(x + 1) - F(x - 1). Or F(x + 2) + F (x + 1) - F(x - 1) - F(x - 2). We can represent different 'derivatives' as function, commonly called filters, operator or detector. A derivative evaluated by f = F(x + 1) - F(x - 1) over all x can be represented as the convolution of the filter f = [-1, 0, 1] with the data F. But what filter should we choose?
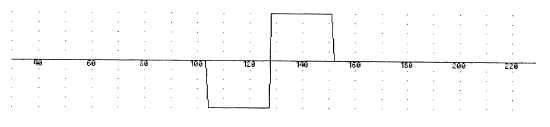
Intuitively, you would choose a filter function that closely matches the type of shape you are trying to detect. For step edges, a symmetrical box filter such as the one below makes sense, as it will give a response to both upward edges and downward edges.
In practice, we generally work with noisy data and a box filter is very sensitive to noise. Canny suggests the use of the first derivative of a Gaussian instead for step edges.
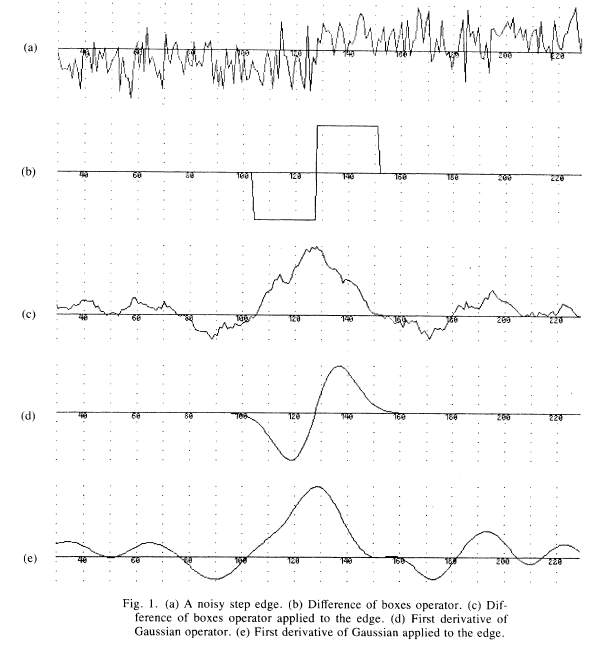
By taking the 'derivative' of (a) at every point with filters (b) and (d), we get (c) and (e) respectively (which I will call response functions), where local maxima corresponds to likely edges. We can see that by using the Gaussian filter, the response function in (e) is much smoother than the function in (c), which means there are fewer local maxima. This is often desirable (but not always - if (a) represented stock prices over a month and we wanted to detect changes in the stock price day-over-day, then (c) might be a more desirable - more in a moment).
So the first principle of our derivation is as follows :
The response function is obtained from the convolution of a filter function and a data function.
This simply says that we can take the 'derivative' of a function at every point using a filter function to get another function representing rates of change.</center>
Now, if we're using a box filter, a natural question arises : how long should the box be? Do we subtract the first point on the right by the first point on the left? The sum of the first 10 points on the right with the sum of the first 10 points on the left? If we are working with the (first derivative of a) Gaussian filter, how much is it stretched?
That brings us back to the stock price example. If we want to detect increases in stock price during day trading, we need a short filter, one that corresponds to a few minutes' worth of data points. If we want to detect increases in stock prices over the course of a year, we need a longer filter, one that corresponds to a few days' worth of data points. If the filter we use is too short for an application, we get a noisy response function with too many local maxima. If the filter we use is too long for an application, the response function is blurred and we can't localize our edges.
Here's an example to illustrate my point. Consider the song 'Stratosphere' by Stratovarius.
The beginning of the song is made of guitar notes of roughly 100ms. Those are the notes we want to detect, they determine the song's beat. Around 0:18 however, the drum kicks in, and the beats are roughly 400ms apart. Then, arguably, the drum represents the song's beat. From a musical notation perspective, it makes no difference, but from an onset/edge detection perspective, it does. Here's what happens when we introduce a scaling factor: using a Gaussian filter of length 11 (left) vs a Gaussian filter of length 21.
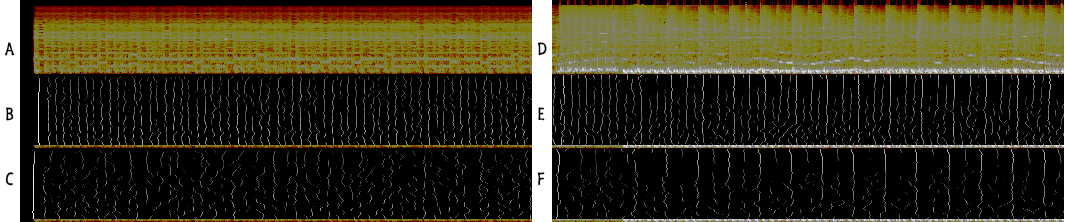
(A) Spectrogram of the first 5 seconds of Statosphere. (B) Local maxima of response function of convolution of A with Gaussian filter of length 11. (C) Local maxima of response function of convolution of A with Gaussian filter of length 21. (D) Spectrogram of seconds 18-23. (E) Local maxima of response function of convolution of D with Gaussian filter of length 11. (F) Local maxima of response function of convolution of D with Gaussian filter of length 21.
We can see that a filter which matches the distance between musical notes in (B) produces a clearly identifiable local maxima for each of the guitar notes. however, if we take a filter the length of two notes in (C), the response function is smudged and is does not provide much useful information. The short filter can identify the drum beats in (E) accurately, but also gives a smudged response for the guitar notes in the background (from a spectrogram, not musical, perspective) and produces a fair bit of random local maxima. Taking a longer filter in (F), isolates the drum beats and reduces noise in the response function. An even longer filter (say size 41) would get rid of the majority of the non-drum local maxima.
That leads to the second principle:
Different scaling factors give different information about a data function.
In particular, it gives information about the different frequencies of a signal.
Now, detection of step edges is very useful in many applications, since most features of an image or song have identifiable edges that set them apart from the background. However, we may want to detect very particular features. For example, we may be interested in 5 pixel thick lines. Can it be done?
All that is needed is to change the shape of the filter function. In his paper, Canny presents the optimal filter from a ridge edge and a step edge as such :
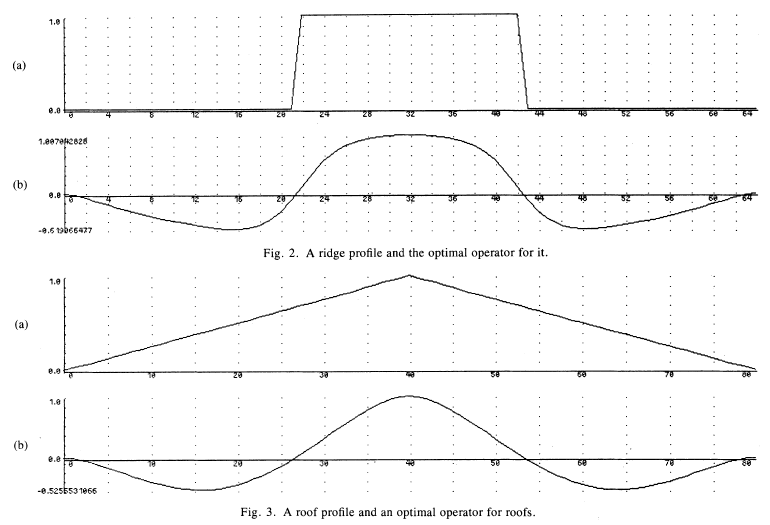
You'll notice that the filter in (b) has a maximum at the center of the ridge and a minimum at each side of the right. This will give local maxima in the response function where the ridges are located. Think about why that makes sense.
So the last principle is :
We can choose our filter function for the purpose of our application.
Wavelets
For those of you who know about the Continuous Wavelet Transform probably guessed the point I want to make by now. The CWT consists in :
1. Choosing a wavelet function.
2. For all scaling factors of the wavelet, do a convolution with the data.
or
1. Choosing a wavelet function [principle 3 : choose the shape of the filter function].
2. For all scaling factors of the wavelet [principle 2 : different scales give different information], do a convolution with the data [principle 1 : response function is obtain from a convolution].
Since we can having scaling factors of any value, we can get as much precision in frequency as we want. This is called multiresolution analysis. By using a function at different scales, the information we obtain is "how much is the data made up of that function at various frequencies?". Remember, just as the fourier transform tells us that function are made of infinitely made sine waves of various amplitudes and frequencies, the wavelet transform tells us that functions are made of infinitely many wavelets (or most arbitrary functions) at various amplitudes and frequencies.
Edge detection, then, is usually just a wavelet transform restricted on a particular frequency/scaling factor. And that's the (intuitive) relation between the two.
